Note
Go to the end to download the full example code.
Multisite data generation with covariates#
Imports#
import matplotlib.pyplot as plt
import pandas as pd
import seaborn as sns

from uniharmony import verbosity
from uniharmony.datasets import make_multisite_classification

sns.set_theme(style="whitegrid")
verbosity("warning")

# There are
X, y, sites, covars = make_multisite_classification(covariates=["age", "sex"])
df = pd.DataFrame({"Class": y, "Site": sites, "Age": covars["age"], "Feature1":X[:,0], "sex": covars["sex"]})
print(f"X has {X.shape[0]} examples and {X.shape[1]} features")

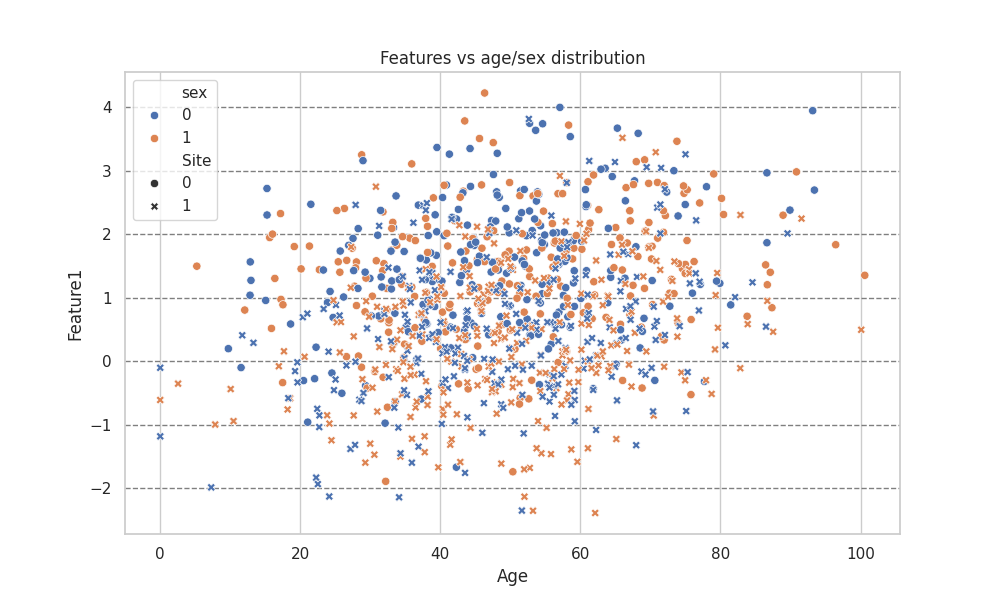
plt.figure(figsize=[10, 6])
plt.title("Features vs age/sex distribution")
sns.scatterplot(df, y="Feature1", x="Age", hue="sex", style="Site")
plt.grid(axis="y", color="black", alpha=0.5, linestyle="--")
X has 1000 examples and 10 features
Total running time of the script: (0 minutes 1.797 seconds)