Note
Go to the end to download the full example code.
Explore ON-Harmony features#
Imports#
import seaborn as sns
import matplotlib.pyplot as plt
import pandas as pd
import numpy as np

from uniharmony.datasets import load_onharmony_structural_features
Downloading data from 'https://raw.githubusercontent.com/Jake-Turnbull/HarmonisationDiagnostics/main/tests/onharmony.csv' to file '/home/runner/.cache/pooch/onharmony.csv'.
================================================================================
Data have shape: (120, 2517)
================================================================================
   idx  ... freesurfer_rh.aparc.a2009s_MeanCurv_S_oc_sup&transversal
0    0  ...                                                NaN
1    1  ...                                                NaN
2    2  ...                                                NaN
3    3  ...                                                NaN
4    4  ...                                                NaN

[5 rows x 2517 columns]
subject_col = "subject"
scanner_col = "scanner_code"

# You can explore other features changing this name
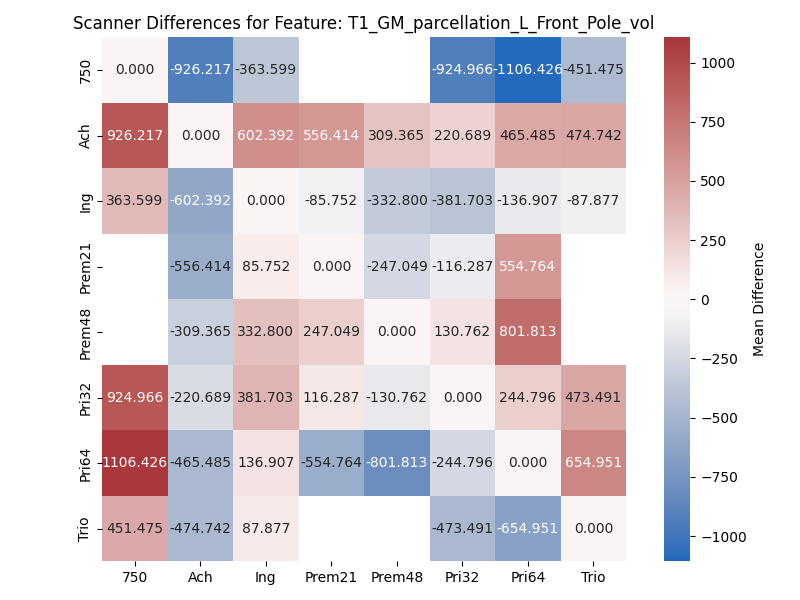
feature_name = "T1_GM_parcellation_L_Front_Pole_vol"

# Filter for the needed features
feature_df = df[[subject_col, scanner_col, feature_name]].copy()

# Pivot to get subjects as rows, scanners as columns
# The values come from the column that actually contains the numerical data
pivot_df = feature_df.pivot_table(
    index=subject_col,
    columns=scanner_col,
    values=feature_name
)

# Compute differences between all scanner pairs
scanners = pivot_df.columns.tolist()
n_scanners = len(scanners)

# Initialize difference matrix (scanner x scanner)
diff_matrix = pd.DataFrame(
    np.zeros((n_scanners, n_scanners)),
    index=scanners,
    columns=scanners
)

# Fill with average absolute differences for each pair
for i, s1 in enumerate(scanners):
    for j, s2 in enumerate(scanners):
        if i != j:
            diff = pivot_df[s1] - pivot_df[s2]
            diff_matrix.iloc[i, j] = diff.mean()

# Plot heatmap
plt.figure(figsize=(8, 6))
sns.heatmap(
    diff_matrix,
    annot=True,
    cmap="vlag",
    fmt=".3f",
    square=True,
    cbar_kws={"label": "Mean Difference"}
)
plt.title(f"Scanner Differences for Feature: {feature_name}")
plt.tight_layout()
plt.show()
Total running time of the script: (0 minutes 1.789 seconds)